

We are into another month, so it is time for me to try and find another lot or two of possibly undervalued stocks that have increased their dividend payments to their owners for 20 or more years. While I am a long, long ways away, the eventual goal of this account is to eventually be turn on another income stream when it is needed.
Screening for Undervalued Dividend Growth Companies
Dividend Growth History
The very first hurdle that a company has to pass is whether it has increased its dividend for 20 or more years. I am looking to build a sustainable income stream, and it is my hope (and all it is a hope) that if they have paid dividends for 2+ decades it is ingrained in their DNA and culture and they’ll continue to do so.
I use the Dividend Champion List (25+ years of dividend growth) and part of the Dividend Contender List (10 to 24 years of dividend growth). The lists are maintained by The DRiP Resource Center.
Price to Earnings
The first metric I screen for is Price to Earnings. Price to earnings is defined as,
the ratio for valuing a company that measures its current share price relative to its per-share earnings.
P/E is probably the most popular way to value stocks. If you are reading this post you should probably already know that price in it of itself is not a measure of a company’s value. In the past I have used different ratios (under 20, under industry average, under both 20 and industry average, under 20 CAPE P/E, etc.) for calendar year 2019 I am going to focus on those stocks with a P/E under 15.
Dividend Yield and Payout Ratio
I am not dividend hunting, but I do want to get paid to have money invested with the company, so I am going to use a dividend yield of at least 2% for calendar year 2019. Much more important than the yield is the Dividend Payout Ratio which is simply the amount of earnings per share that is being used to support the dividend. While sources will have different views on the topic I like Dividends.com guidelines,
A range of 35% to 55% is considered healthy and appropriate from a dividend investor’s point of view. A company that is likely to distribute roughly half of its earnings as dividends means that the company is well established and a leader in its industry. It’s also reinvesting half of its earnings for growth, which is welcome.
Free Cash Flow Yield
New for 2019 is Free Cash Flow Yield.
Free cash flow measures the cash available to shareholders after a company has paid all of its bills in full. Buffett relies heavily on a similar metric that he dubs “owner earnings.”
One way to gauge a firm’s cash flow production is to examine its free cash flow yield. This is calculated by dividing free cash flow by market capitalization, or the inverse of the Price/FCF ratio. A firm with a free cash flow yield of 10%, for example, generates 10% of its total market value in cash each year. That cash, in turn, can be used to pay dividends or fund share buybacks — items that enhance shareholder returns.
Having seen a bunch of a different articles on the topic I liked this one best explaining where my gauge should be:
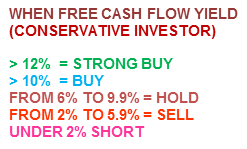
Having used the Free Cash Flow Yield a zillion times over the years, I have come up with these conservative parameters for my own investing.
For the more Aggressive, as well as the “Buy and Hold” investor, I would adjust everything down a notch, and for example, would make the hold from 2% to 5.9% and the buy from 6% to 9.9% and sell anything under 2%. As for shorting a stock that would be any result under zero, including any negative result. Here is a listing of those parameters for easy reference.
Since this is a pure buy and hold account I set my screener at 6%+ for Free Cash Flow Yield.
My March 2019 Watch List
I can’t believe it, after the screens I ended up with only 4 options, and I have positions in all 4 already!
| Ticker | Name | Dividend Yield | P/E Ratio (LTM) | Payout Ratio | Free Cash Flow Yield |
| T | AT&T Inc. | 6.8% | 6.5x | 38.1% | 9.5% |
| TGT | Target Corporation | 3.3% | 12.2x | 41.2% | 6.9% |
| CTBI | Community Trust Bancorp, Inc. | 3.5% | 12.8x | 40.8% | 8.7% |
| AROW | Arrow Financial Corporation | 3.1% | 14.2x | 39.6% | 8.5% |
So now I have to narrow the list down to one purchase for right now. Immediately, I thought:
- I just bought my first position in AROW last month;
- I own a lot of TGT through out my accounts and they just had a pop from earnings (I know the second statement shouldn’t matter but it’s hard to ignore it);
- CTBI – I know I own some shares, but have zero recollection when I bought them and I have not seen that name in a long, long time.
The CTBI interested me, because if I haven’t seen that name pop up in a while it means that the stock either had to grow to fit into the metrics above or the price has had to drop.
 So it looks like my average purchase price is $39 and change which means my purchases had to be a few years ago. This sort of excited me to do some further research. Why the pull back? It seems that all regional banks pulled back a bit over the same time frame, so I took a look at the most recent 10-k, and didn’t see anything alarming (granted I don’t have a ton of experience reading these reports especially as they relate to banks).
My March 2019 Purchase
I decided to purchase 15 shares of CTBI.