
Once a month I manually screen for undervalued stocks that have paid an increasing dividend for at least 20 years. The “increasing dividend” requirement actually eliminates about 95% of all US stocks leaving me with only approximately 150 companies to start applying valuation metrics. But, before looking at future investments, I want to highlight my activity in March 2015.
Dividend Investment Portfolio Activity in March 2015
On March 3 I sold:
- My small position in Bemis (BMS) – I only owned 18.597 shares of the company. Looks like I bought my original 18 shares (the fractional shares were reinvested dividends) in November of 2013.
- My position in Coke (KO) – I owned 28.030 shares of KO (I bought two lots of KO, 15 Shares on 7/17/13 and another 12 shares on 2/18/2014 and then another 1.030 shares from reinvested dividends).
Unfortunately, I didn’t record why I sold them. My guess is that when I looked their valuations were HIGHER than what I am comfortable with. For example, BMS has a P/E on 4/9/2015 of 19 but that is after it has declined some 7% since my sale date which would indicate the P/E would have been even higher. In the future, I have to write down the metrics that cause me to sell!
On March 6, 2015 I initiated my position in PRE, a reinsurance company, buying 5 shares for a cost basis of $578.30. Again, I didn’t write down the metrics of the day I bought, but since the stock is relatively similar I can take today’s (4/9/2015) metrics:
- P/E – 5.9 vs 7.9 Industry
- P/B .8 vs 1 industry
- Operating Margin – 20% vs 18.7 Industry
- Yield – 2.34%
- Payout ratio – 29.3%
Adding March 2015 Dividend Income to the Cumulative Chart
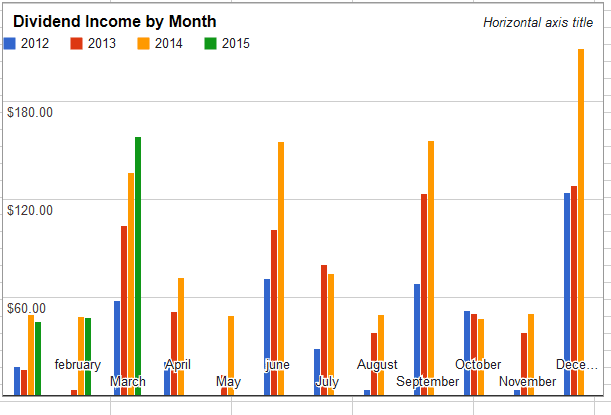
 Just need to make sure we are going in the right direction.
Attempting to Find Undervalued Dividend Champions for April 2015
This, along with everyone of these dividend research updates, is a snap shot in time (this one was on the night of April 8, 2015). So please don’t use my data as anything but a starting point for your own research. I use the metrics below to get to a “watch list” which I use to try and purchase equities closer to their 52 week low.
My Dividend Investment Portfolio Screening Criteria
The first five steps’ data is taken, manually, from Morningstar while Dividend Payout Ratio is taken from Dividend.com:
- The company has paid increasing dividends for at least 20 years
- The stock has to have a Price to Earning that is lower than their industry average. The Price to Earnings Ratio has to below 20 regardless of industry average.
- The Operating Margin has to be in line with the particular stock’s industry average. I want companies that are profitable as compared to their peers.
- Price to Book – Should be below 4, but if it isn’t it must be in line with industry average (or lower).
- This monthly update the Dividend Yield should be above 2.4% (changes whenever I update the list depending how many stocks I have left after the first 4 steps).
- Dividend Payout Ratio – It took me a long time to add this to my screen but basically I weed out any companies paying over 60% to shareholders. Couple reasons. The main one would be sustainability, but also, I do want growth in a company and if all dollars are going out it is likely to hurt the company in the long run.
Since this is a snapshot I am not that strict since I am well aware that if the underlying company opens a tenth of a percent the other way it could pass a metric.
Definitions of Metrics Used for my Dividend Investment Portfolio
Since not everyone knows what I am talking about above I have provided definitions (all quotes taken from Investopedia):
- Dividend Champions are those dividend paying American companies that have increased their dividend for the past 25 years. Unlike the Dividend Aristocrat list they do not have to be part of the S&P 500. I have included a part of the dividend contenders list (20+ years but less than 25).
- P/E is Price is “a valuation ratio of a company’s current share price compared to its per-share Earnings.”
- Operating margin is “a measurement of what proportion of a company’s revenue is left over after paying for variable costs of production such as wages, raw materials, etc. A healthy operating margin is required for a company to be able to pay for its fixed costs, such as interest on debt.”
- Price to book is a ratio used to compare a stock’s market value to its book value. It is calculated by dividing the current closing price of the stock by the latest quarter’s book value per share.
- Dividend Yield a “Financial ratio that shows how much a company pays out in dividends each year relative to its share price. In the absence of any capital gains, the dividend yield is the return on investment for a stock. Dividend yield is calculated by dividing Annual Dividends per Share by Price Per Share”
- Payout Ratio – “The proportion of earnings paid out as dividends to shareholders, typically expressed as a percentage…The payout ratio is a key financial metric used to determine the sustainability of a company’s dividend payments.
Applying My Stock Screen Criteria to the Dividend Champion List
First Stock Screen: PE Ratio
The first Stocks I their eliminated were those whose Price to Earnings Ratios were out of line with their industry average. I also eliminate companies with PEs above 20 regardless of their industry average. This brought me down from 157 equities to 63!
Second Stock Screen: Operating Margin
Next I eliminated those stocks whose operating margin was not better than its peers in the industry. I want the companies I invest in to be more profitable than their peers. This way unless there is a huge problem with the industry they’d be less likely to stop doing something (i.e. paying increasing dividends) that they have been doing for the past 20+ years
Third Stock Screen: Reasonable Price to Book or in line with their Industry
I was looking for those stocks whose price to book value is low as to further evidence that it is undervalued. In an effort to limit the unintended consequence of choosing stocks with a lot of tangible or financial assets on the books I have started comparing the P/B to the industry average.
Fourth Stock Screen: Yield
While I am not ‘chasing yields’ I am attempting to create a dividend portfolio, so the next elimination step was to remove any stocks with a dividend yield of less than 2.4%. This is a moving target depending on how many stocks I have left to choose from. Sometimes I go for 2% sometimes 4%
Fifth Stock Screen: Payout Ratio
Next, I eliminated those equities whose payout ratio was 60%+. I am not sure if this was a good level but from the articles that I have read indicate that is the top end for most stocks.
Undervalued Dividend Watch List for April 2015
| Name | Symbol |
| Arrow Financial Corp. | AROW |
| Atmos Energy | ATO |
| Black Hills Corp. | BKH |
| Community Bank System | CBU |
| Community Trust Banc. | CTBI |
| Cullen/Frost Bankers | CFR |
| Eagle Financial Services | EFSI |
| Emerson Electric | EMR |
| First Financial Corp. | THFF |
| First of Long Island Corp. | FLIC |
| Genuine Parts Co. | GPC |
| Johnson & Johnson | JNJ |
| MGE Energy Inc. | MGEE |
| NextEra Energy | NEE |
| Tompkins Financial Corp. | TMP |
Lastly, I take the watch list and look for equities closer to their 52 week low while keeping in mind all the other metrics to find one or two lots of $500 to $1,000 to purchase.
Anyone have any strong feelings about any of the companies?
Thanks for the screen. I’ve been trying to buy JNJ under $100 but the markets have been doing too well this week and have foiled my plans so far. I own TMP as well, but it’s had quite a run since late last year.